10 Best Infographic Makers: Features, Pricing, and Selection Guide

We are living in an era where vital information is communicated through creative infographics. Though there are countless infographic makers available online, the struggle to find the perfect fit is real. From juggling features to decoding pricing structures, the quest for the ideal tool is a common challenge for infographic marketing. Hence, we are here with this blog as a compass for the best infographic makers.
Best Infographic Makers for Your Business
- DocHipo: User-friendly, intuitive drag-and-drop editor with free and premium templates for every industry.
- Piktochart: Data-driven visuals with real-time data integration.
- Infogram: Templates for diverse needs, including data visualization.
- Canva: Intuitive interface with versatile design elements.
- Venngage: Specialized in data-driven visuals and flowcharts.
- VistaCreate: User-friendly, animated templates for social media.
- Adobe Creative Cloud Express: Integrates with Adobe Creative Cloud and includes professional templates.
- Visme: Emphasizes ease of use for business documents.
- DesignCap: User-friendly, statistical charts in the free version.
- Snappa: Extensive library of graphics, icons, and fonts.
We understand the woes; therefore, we’ve made a list of the top 10 infographics tools to discuss every ins and outs of their features and affordability. Let’s understand the exceptional capabilities and limitations in design options, pricing models, and helpful facts about choosing the right one.
Table of Contents
Best Infographic Makers
As the internet is flooded with new and free design tools, many fail to deliver features crucial for creating polished, professional infographics. Marketers and upcoming content creators often need help with subpar platforms. We ensure that the following top 10 best infographic makers can overcome these challenges seamlessly.
1. DocHipo
We all know how vital infographic marketing is for your online community. That’s why infographic generators should be quick, easy-to-use, and full of engaging infographics design ideas! If that’s what you’re looking for, you’ll love DocHipo.
Need a standout infographics design for your business, a process infographic for the internal teams, or some handy how-to tips? DocHipo has your back with fantastic, free infographic template designs for various niches and content topics, neatly organized in separate categories to make them easy to find.
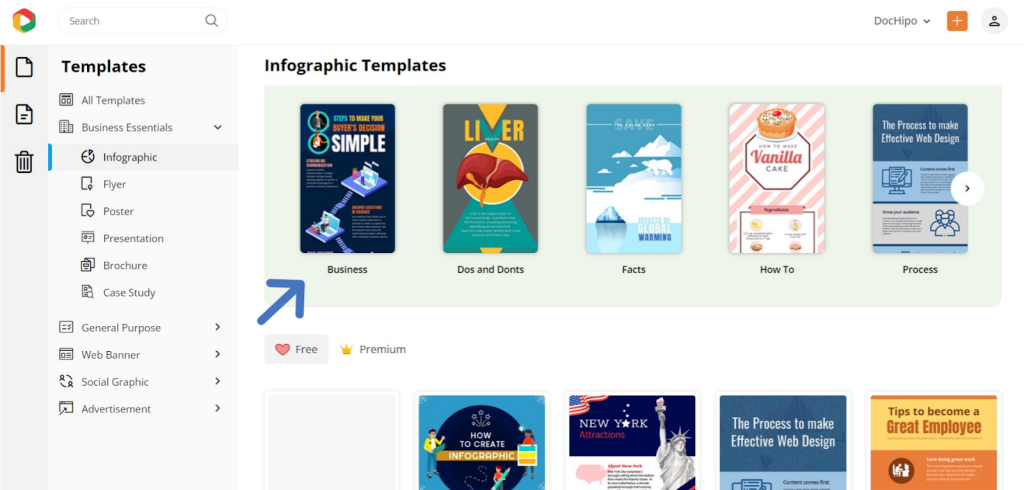
It is a user-friendly graphic design solution featuring an intuitive drag-and-drop editor for quick and perfect infographic creation. It stands out with its simple yet sleek UI and expansive design canvas tailored for making a creative infographics design.
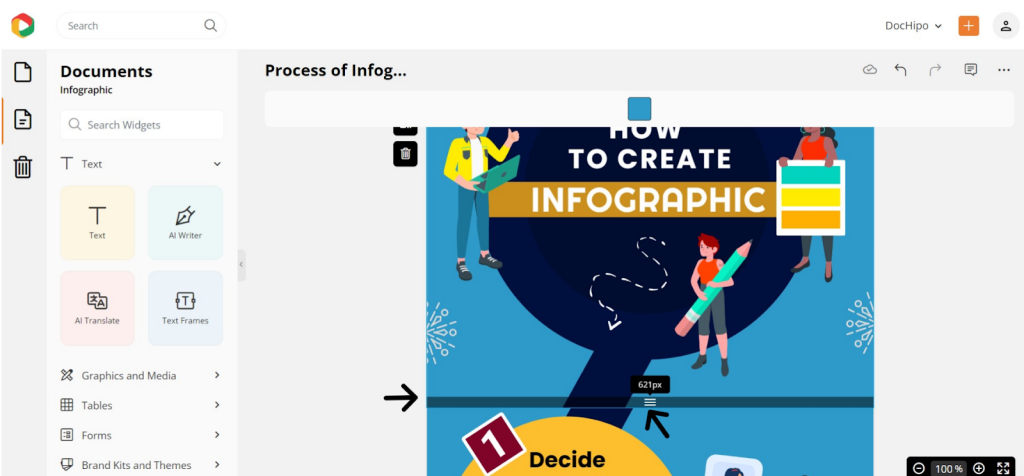
This online infographic maker emphasizes a balanced design with a visual hierarchy, bold graphics, and ample white space for optimal readability. It provides infographic templates with attention-grabbing layouts, quirky shapes, charming fonts, and catchy typography. DocHipo’s design widgets are inspirational, featuring hand-drawn, flat, and creative illustrations, thematic icons, animations, and a blend of minimalism and abstract art.
Consistently use all brand elements in your infographics to enhance brand recognition. DocHipo’s Brand Kit stores your assets in one place, enabling quick and on-brand design creation. Additionally, apply complementary color schemes effortlessly with a click by choosing from a range of color themes to refresh the infographics layout.
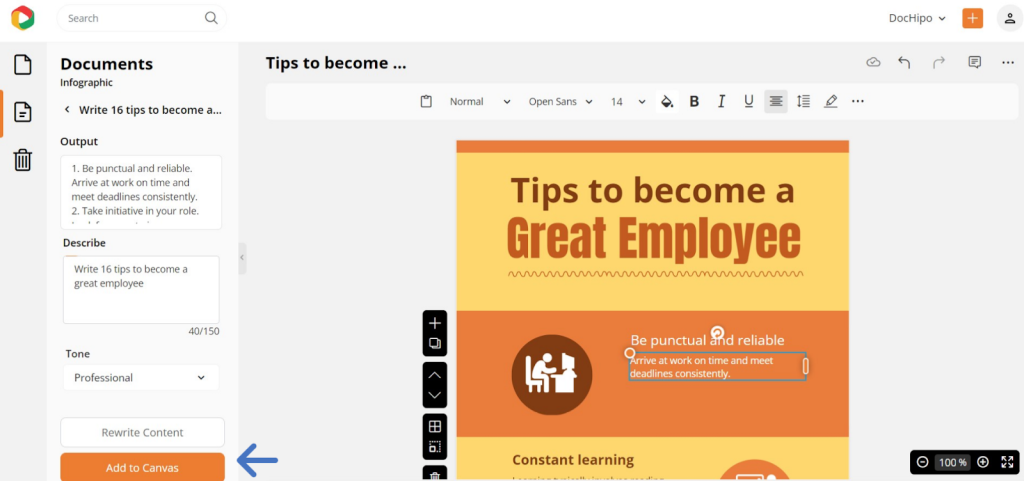
Throw in a little AI magic to create insightful infographic texts quickly with AI Writer using short prompts, remove backgrounds, translate in over 100 languages with AI Translate, or create engaging visuals for the best information graphics instantly with the AI text-to-image Generator.
Moreover, ace your email marketing with MailChimp integration from DocHipo. Also, you can seamlessly collect responses using Typeform and Jotform integrations in your infographics. Additionally, you will love it for ample cloud-based storage with easy access, real-time collaborative capabilities, and easy sharing options.
Also, downloading your infographics comes with a bonus – pick from a bunch of cool file formats, from JPG and PNG to PDF, MP4, and even GIF, all without any watermarks! If you want to make valuable infographics for your viewers, sign up for the DocHipo infographic maker.
Get started with DocHipo for making infographics with ease!
Pricing
Explore DocHipo’s free plan and enjoy its customizable templates and exclusive features as an exception from the alternative infographic makers—it’s like having a design playground open 24/7! When you’re ready to take it up a notch, get the Pro plan at just $7.5 per user/month for a small team, or choose Pro Unlimited for $225/month for unlimited user collaborations in large teams.
And here’s the bonus: DocHipo lets you have your plan in over 15 different currencies with pricing made for your country. Now, that’s design magic with a sprinkle of convenience!
DocHipo Infographic Maker Ideal for
DocHipo is like a design genie, making every creative wish come true! You can create infographics in minutes with its online infographic maker software. Whether it’s jazzing up your company logo or sprucing up your blog banner, DocHipo’s got the templates for every design whim. This all-in-one graphic design wizard caters to everyone – from individuals and corporations to teams, enterprises, and agencies.
Creating Infographics with DocHipo
Join DocHipo, one of the best infographic makers, and kickstart your document design in just three easy steps!
Step 1: Select Your Template
After signing up, go to the homepage and explore the numerous customizable infographic templates.
Step 2: Customize Your Template
Select your preferred template and tailor it to perfection using DocHipo’s editing features. Adjust as needed to match your requirements.
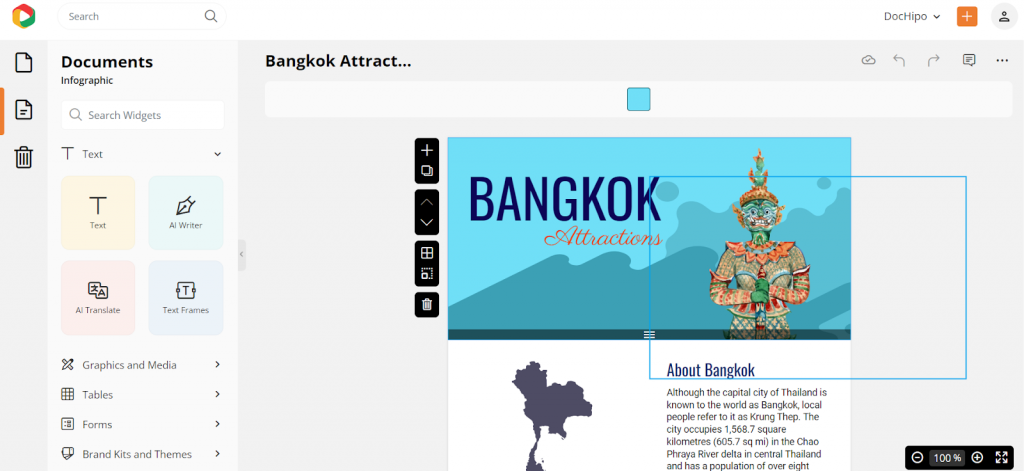
Let’s say we want to change the background color scheme to some yellow tint, deep peach, and dusty orange hues. With DocHipo editor, we can change the background color and edit colors in each section and graphic element.
DocHipo Editor has convenient editing tools for colors, fonts, photo filters, and other design effects. Look how easily we changed the colors with the color fill option.
Now, let’s try something new with the texts.
Change the look of your text with the effect option from the panel.
Also, you can add new graphic elements to this design to make customizations easily.
Select graphics and media to go to the icons widget, then choose the one you want to add to your design.
The following document is the final infographic design we created in a minute with super-easy customization tools.

Step 3: Download Your Infographic Design
Choose the correct file type and format for your design, then simply hit download to save it on your device without any watermark. Also, you can publish it directly on social media or via e-mail.
2. Piktochart
Pictochart is a decent choice for trying new infographic maker sites, especially if you want to incorporate data-driven visuals using various charts. The platform allows customization of templates with data visualization charts linked to real-time data through Excel. If you like creative infographics, try its AI tools that work moderately for your initial unique design. But you need proficient customization skills to turn it into a fabulous infographic design.
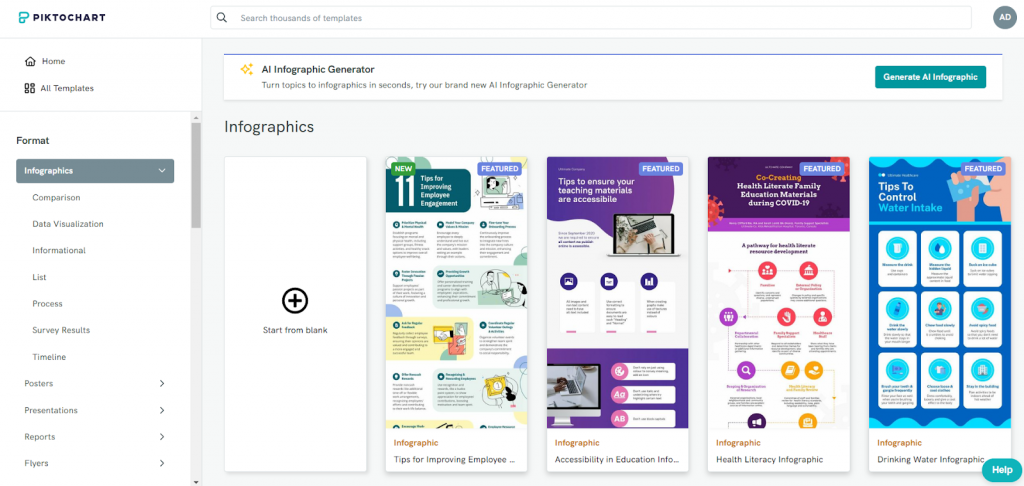
However, it’s worth noting that upgrading to the premium version is necessary to unlock a broader array of graphic elements like icons, stickers, and illustrations.
Additionally, users have expressed feedback on the collaboration features, suggesting potential areas for improvement, especially in comparison to alternative collaborative design tools.
Pricing
Piktochart offers a free plan with limited access. The Pro Plan is $14 per user/month (billed annually) and provides 100 GB storage. The Business Plan, priced at $24 per user/month (billed annually), comes with 250 GB storage. Custom pricing options are also available for enterprises.
Ideal for
While Piktochart is recognized for business documents and data visualization, some users may need to be more intuitive to create visually compelling infographics than alternative platforms.
3. Infogram
Infogram provides a variety of templates catering to different needs, like data visualization and reports. Visual elements like maps and charts in the library can bring more meaning to your designs.
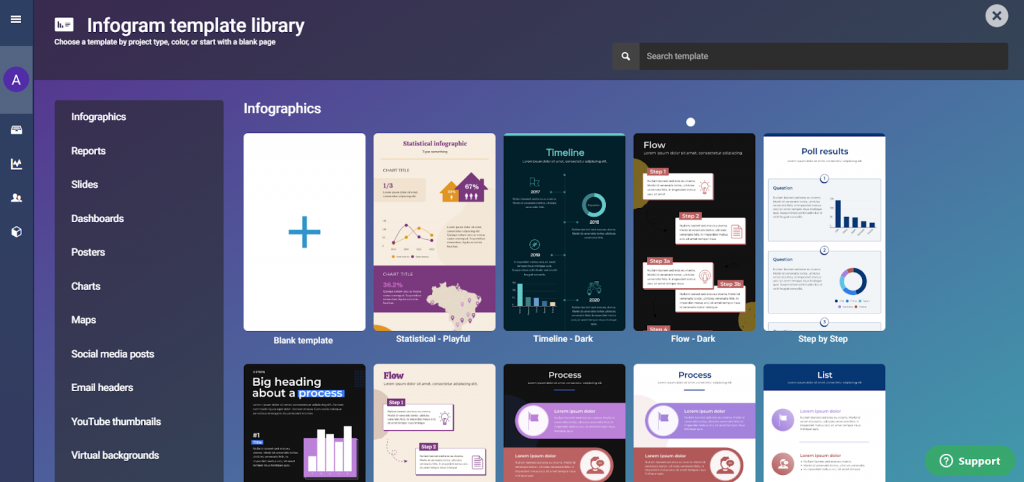
However, it’s essential to note that the free version has some feature and visualization limitations, which might pose restrictions for users with advanced design requirements.
Additionally, while Infogram offers basic customization options, users aiming for highly tailored visuals might need help with fine-tuning designs from other infographic making software.
Pricing
Explore Infogram’s capabilities with the free plan for basic design needs. If you’re ready for more features, consider the Pro plan at $19/month, the Business plan at $67/month, or the Pro Team plan at $149/month (billed annually).
Ideal for
It is ideal for creating visually appealing and data-driven content for marketing campaigns.
4. Canva
Canva has an intuitive interface and a wealth of versatile features that make designing a breeze. Canva design elements follow up-to-date designs and prompts, but most of these elements require a paid subscription.
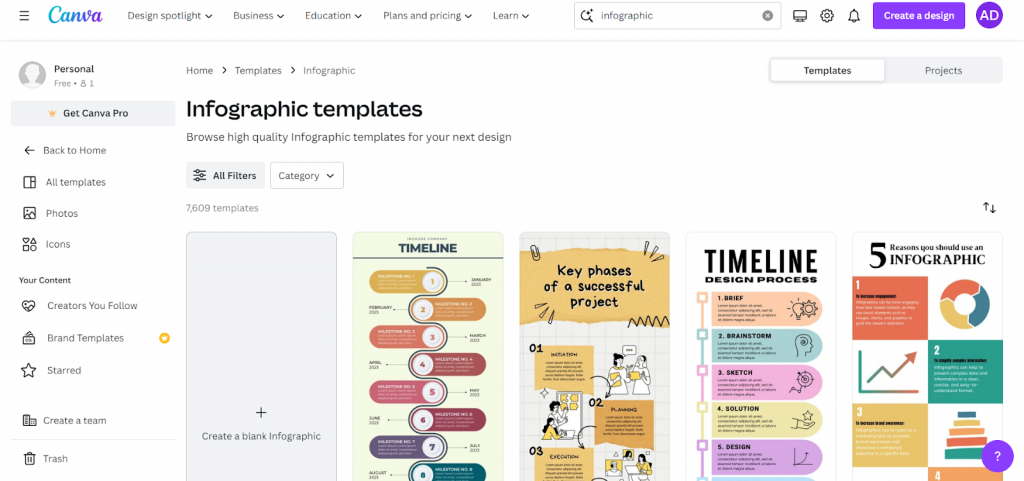
While Canva enjoys a robust reputation in graphic design, working with its persistent watermarks in the free plan can be a downer. Free users might face limitations as the popularity of free templates rises, hinting that upgrading to the paid plan could be a smoother design journey. Also, if you have a specific industry-based content need, you may feel fussy initially about such overwhelming options at one go!
Pricing
Canva’s free plan restricts most of the unique templates, icons, and design assets. For comprehensive access, Canva presents two premium options:
1. Canva Pro – Priced at $14.99 monthly for a single user, billed annually.
2. Canva for Teams – $29.99 monthly for five users, billed annually.
Ideal for
Canva is an excellent graphic design tool, especially for those new to the graphic design world.
5. Venngage
Venngage specializes in crafting data-driven visuals for intricate information like flowcharts, maps, timelines, etc. It can be used mainly for business or corporate infographics. If you want to customize with a paid version, you can have many fascinating options in icons that fall into various categories. From professional to casual, find different vibes according to your target audience.
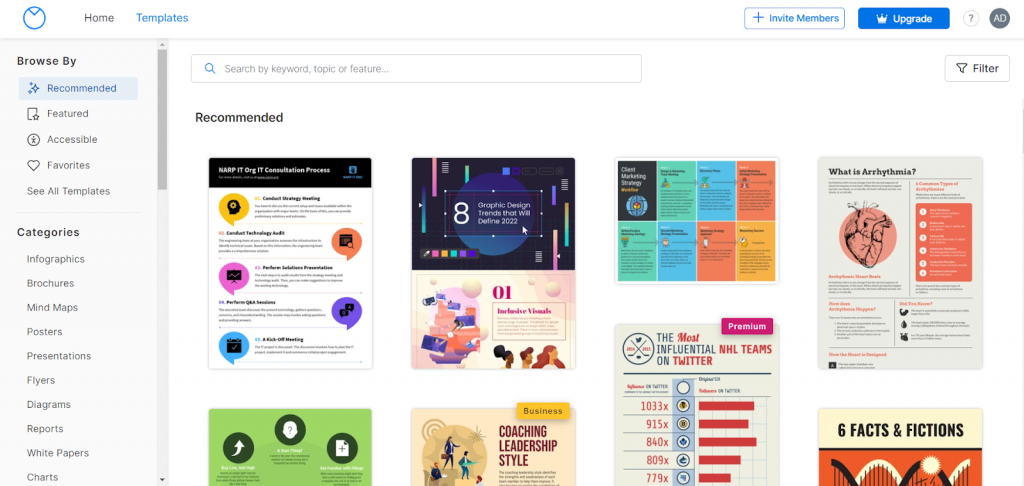
However, if you are trying a free infographic maker, this will be slightly off since most graphic elements are locked for a paid subscription. Additionally, its AI capabilities could be improved, lacking integration with third-party tools.
Pricing
You can try the free option, but it has its own limits. Upgrade to its Premium plan at $10 per month per user or opt for the Enterprise plan at $499 monthly for 10+ users – both billed annually.
Ideal for
Venngage can be used to create polished and professional visuals, particularly in infographics.
6. VistaCreate
Vistacreate (formerly Crello), as one of the free infographic creators, makes the infographic journey easy with its user-friendly interface and many animated templates. Tailored for individuals and teams, Vistacreate caters to online and offline design demands. It has a 14-day free trial that is useful if you want to get the feel of the tool and make yourself more comfortable with infographic making.
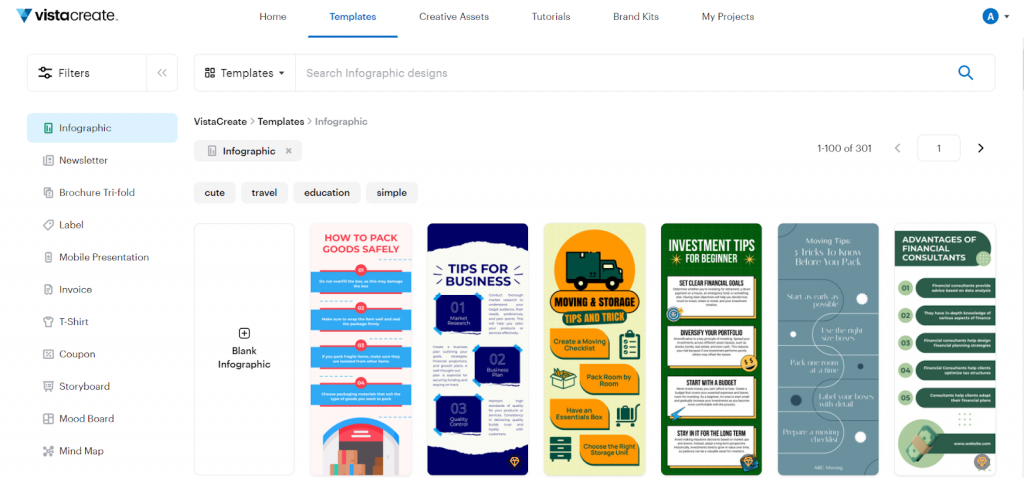
While Vistacreate is unquestionably a capable editing tool, its charm could get a boost with improvements in AI-powered features and the addition of app integrations.
Pricing
Explore the tool with a limited-feature free plan for trial purposes. Unlock advanced capabilities with the Pro plan, priced at $10 monthly when billed annually.
Ideal for
Vistacreate caters to amateur infographic designers who enjoy experimenting with laid-back social media designs. The tool is commonly employed for sharing informal infographics and animations, making it a go-to for casual design enthusiasts.
7. Adobe Creative Cloud Express
Adobe Creative Cloud Express opens the door to a plethora of professionally crafted templates and the same for infographic templates. Seamlessly blending projects with other Adobe Creative Cloud applications ensures an effortlessly flowing design process. However, the free version has its constraints, limiting access to advanced features, unlike other good infographic websites.
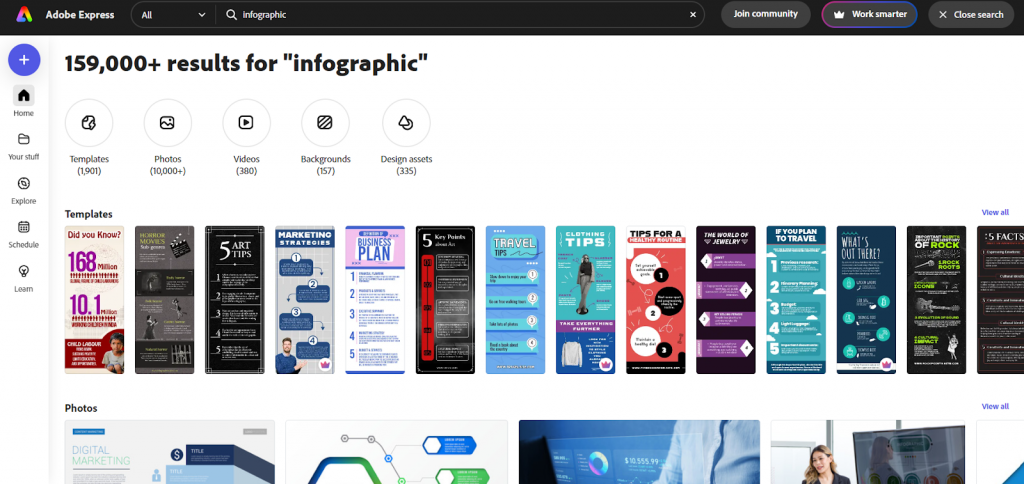
While user-friendly, Adobe Creative Cloud Express may require a learning curve for graphic design beginners. The subscription cost, leaning towards the premium side, might be a consideration for those mindful of their budget.
Pricing
You can hop on the free plan or go for the Premium Plan, which is priced at $99.99 per year.
Ideal for
Adobe Express is for anyone who wants to design for social media or is a pro graphic designer.
8. Visme
Visme is a good option for creating infographics and other business documents with data visualizations, emphasizing its ease of use. This tool will be helpful if you want to try statistical or timeline infographics.
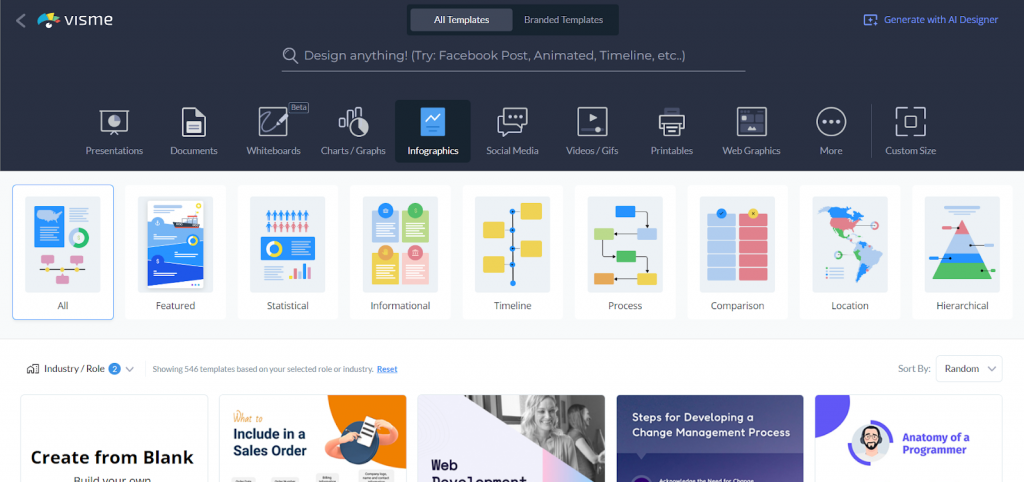
While it offers templates for business and social media uploads, some users may find its editing options somewhat extensive, and the interface could use a more contemporary touch. Remember that Visme’s premium features come with the paid plan, unlocking various download options for your designs.
Pricing
In addition to the free plan, Visme offers a Starter plan priced at $12.25 per month and a Pro Plan at $24.75 per month, both billed annually.
Ideal for
The tool caters to people who want to make social media content and individuals searching for templates relevant to corporate documents.
9. DesignCap
DesignCap is a handy infographic generator with a user-friendly interface. However, the free version comes with some strings attached. However, you can leverage its free versions of different charts for statistical infographics.
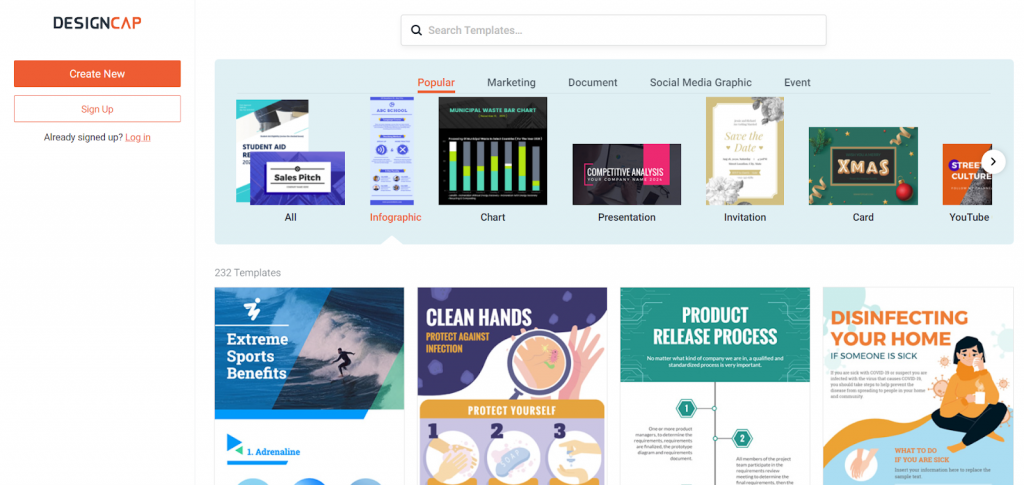
Advanced features are limited, so professional content creators might need other tools to fulfill their artistic needs. Plus, the DesignCap watermark on designs from the free version might be different from everyone’s cup of tea, especially for those aiming for an utterly brand-free finish.
Pricing
In addition to the Free Plan, there’s the Basic Plan at $4.99 per month and the Plus Plan at $5.99 per month (billed annually).
Ideal for
DesignCap is helpful for amateur content creators and social media marketers.
10. Snappa
Snappa generously offers a library teeming with graphics, icons, and elements to spruce up your infographics. Snappa has an enormous collection of fonts you can flex in your infographics.
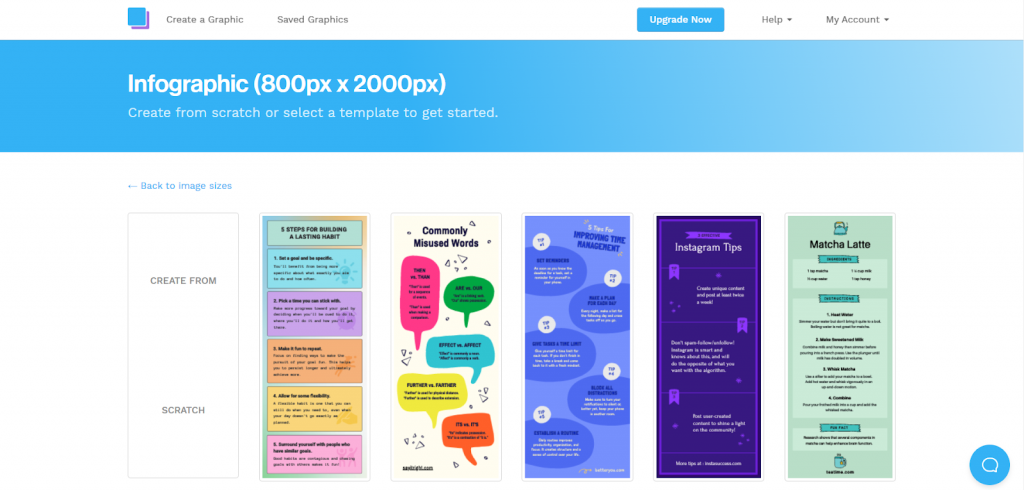
However, users need help with restricted export options if they aim for high-resolution print-ready files.
Additionally, while the subscription cost is reasonable, budget-conscious users might think twice or explore free alternatives.
Pricing
Snappa provides a complimentary plan alongside its paid options, featuring a Starter plan priced at $10 per month and a Team Plan available at $20 per month, both billed annually.
Ideal for
Snappa suits professionals seeking an easy-to-use graphic design tool to create infographics and marketing materials.
How to Choose the Right Infographic Creator
Selecting the best infographic software free to use is crucial for bringing your data to life. There are several factors to consider when choosing the right tool for your infographics so that you don’t get misled.
1. Look for a User-Friendly Interface
A user-friendly platform ensures a smoother design process, even for those without extensive design experience. Begin by identifying the purpose of your design. Choose an infographic generator that aligns with your niche. Then, having an easy UI allows you to create designs related to your specific industry.
2. Template Variety
Explore platforms that offer a diverse range of infographic templates. Various template options will enable you to find a style that aligns with your content and resonates with your audience.
3. Advanced Customization Options
Opt for a tool that provides ample customization options. With time, you would love to have more customization options for creating more exciting and engaging infographics. Most infographic makers keep all the latest graphic elements for premium subscriptions. So, choose an infographic maker that offers attractive customization options without any initial paid subscription.
4. Collaboration Features
If you’re working with a team, choose an infographic creator that supports collaboration. Features like real-time editing, commenting, and sharing can enhance teamwork and streamline the design process.
5. Export and Sharing Options
Check for convenient export options to save your infographics in different formats. Additionally, assess sharing capabilities to ensure easy distribution across various platforms and channels.
6. Affordable
Evaluate the pricing structure and plans offered by the infographic creator. Consider your budget and requirements, and choose a tool that provides value for your investment.
7. Customer Support
Look for platforms that offer reliable customer support. Whether through tutorials, FAQs, or direct assistance, having access to support can be invaluable in navigating any challenges you may encounter.
Conclusion
If you want to generate infographics that will stun your audience, try DocHipo, one of the best infographic makers and a reliable go-to design tool for every professional or non-professional content maker. All the essential factors you should look for in an ideal infographic maker are the salient features of a DocHipo infographic maker. So, sign up immediately and start making unique infographics for your clients.
FAQs
Where to Make Infographics?
DocHipo is one of the best infographic makers. Its user-friendly interface and versatile design options make it the ideal platform for infographic creations.
How to Make the Best Infographic?
If you want to make the best infographic, choose a topic your audience is searching for. Then, choose a compelling template, add a clear and concise message, incorporate eye-catching visuals, and maintain a cohesive design. Keep it engaging and focused for maximum impact.
What is the Fastest Way to Make an Infographic?
The quickest way to create an infographic is by using online infographic makers or design tools that offer user-friendly interfaces and pre-designed templates. You can log in to DocHipo, Piktochart, Infogram, etc, for quick infographics. Simply select a template, customize the content, and download your infographic in no time.
How do I Make My Own Infographic?
Use an infographic maker like DocHipo, Canva, or Piktochart to craft your own infographic. Choose a template to customize content, visuals, and colors. Add data points, and you have your unique infographic for branding!
What Not to Do When Making an Infographic?
When crafting your infographic, avoiding overwhelming your audience with excessive text or overly complex visuals is crucial. Prioritize simplicity, maintain a clear message, and ensure optimal readability for an effective and engaging design.
What is the Best Free Infographic Maker?
DocHipo is one of the best free infographic makers, offering user-friendly tools and versatile templates.


